Handling bars and instruments
Data is understood as information that is retrieved externally and uploaded to AgenaTrader, or as data series that are created by AgenaScripts.
Further detailed information can be found using the appropriate shortcuts:
Bars
Functionality
A classical indicator calculates one or multiple values using an existing data series.
Data series can be anything from closing prices to daily lows or values of an hourly period etc.
Every period (meaning all candles of one day, one hour etc.) is assigned one or more indicator values. The following example is based on an indicator value, such as with a moving average, for example. To calculate a smoothed moving average, AgenaTrader needs a data series. In this example we will use the closing prices. All closing prices of a bar (candle) that are represented in the chart will be saved in a list and indexed.
The current closing price, meaning the closing price of the bar that is on the right-hand side of the chart, will be assigned an index of 0. The bar to the left of that will have an index of 1 and so on. The oldest bar displayed will have an index value of 500.
Whenever a new bar is added within a session it will become the new index 0; the bar to the left of it, which previously had an index of 0, will become index 1 and so on. The oldest bar will become index 501. Within a script (a self-created program/algorithm) the Close will be representative for the array (list) of all closing prices. The last closing price is thus Close [0]; the closing price previous to this will become Close [1], the value before that will become Close [2] and the oldest bar will be Close [501]. The number within the squared brackets represents the index. AgenaTrader allows you to use the „bars ago" expression for this in general cases.
Obviously, every bar will not only have a closing value but also a High, Low, Open, Median, Typical, Weighted, Time and Volume. Thus, the high of the candle that occurred 10 days ago will be High [10], yesterday’s low Low [1]...
Important tip:
The previous examples all assume that the calculations will occur at the end of a period. The value of the currently running index is not being taken into consideration.
If you wish to use the values of the currently forming candle then you will need to set the value of
CalculateOnClosedBar to „false".
In this case the currently running bar will have the value 0, the bar next to the current bar will have the value 1 and so on. The oldest bar (as in the example above) would now have the value 502.
With close [0] you would receive the most recent value of the last price that your data provider transmitted to AgenaTrader. All values of the bar (high [0], low [0]…) may still change as long as the bar is not yet finished/closed and a new bar has not yet started. Only the open [0] value will not change.
Properties
Properties of Bars
"Bars" represents a list of all bars (candles) within a chart (see Functionality, Bars).
Bars (public IBars Bars) can be used directly in a script and equates to BarsArray [0] (see Bars.GetNextSessionTimeSpan for more information).
The list of bars itself has many properties that can be used in AgenaScript. Properties are always indicated by a dot before the objects (in this case bars, list of candles).
With the OnCalculate() method you can use any properties you want without having to test for a null reference. As soon as the function OnCalculate() is called up by AgenaScript, it is assumed that an object is also available. If you wish to use these properties outside of OnCalculate() then you should first perform a test for null references using if (Bars != null).
Bars.Count
Description
Bars.Count gives you the amount of bars in a data series.
See Properties for additional information.
Return Value
Type int Amount of Bars
Usage
Bars.Count
More Information
The value of ProcessingBarIndex can only be lesser than or equal to Bars.Count - 1
When you specify how many bars are to be loaded within AgenaTrader, then the value of Bars.Count is equal to this setting. In the following example, Bars.Count would give back a value of 500.
Example
Print ("There are a total of" + Bars.Count + "bars available.");
Bars.CurrentSessionBeginTime
Description
Bars.CurrentSessionBeginTime outputs the date and time for the beginning of the current trading session.
Date and time for the beginning of the current trading session will be displayed correctly when the function is used on a bar that has occurred in the past.
Parameter
None
Return Value
Type DateTime
Usage
Bars.GetSessionBegin
More Information
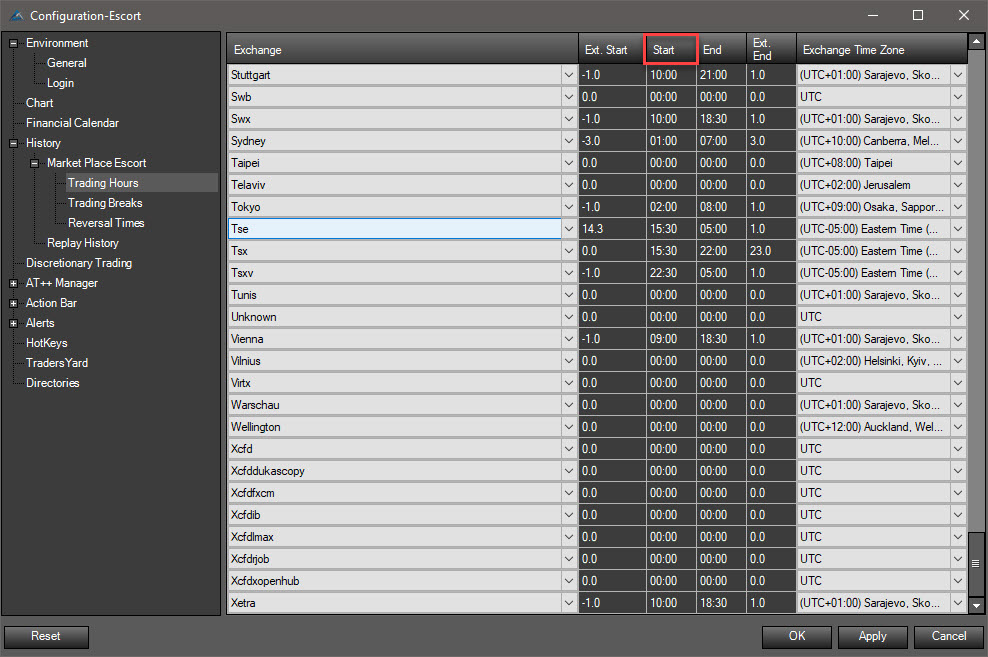
The time for the returned value will equal the starting time defined in the Market Escort for the specified exchange. The value itself is set within the Instrument Escort and can be called up in AgenaScript using the function Instrument.Exchange .
Example
Print("The currently running trading session started at " + Bars.CurrentSessionBeginTime );
Bars.CurrentSessionEndTime
Description
Bars.CurrentSessionEndTime outputs the time for the end of the currently running trading session. Date and time for the end of the current trading session will, in this case, also be outputted correctly when the function is used on a previous bar.
Parameter
None
Return Value
Type DateTime
Usage
Bars.GetSessionEnd
More Information
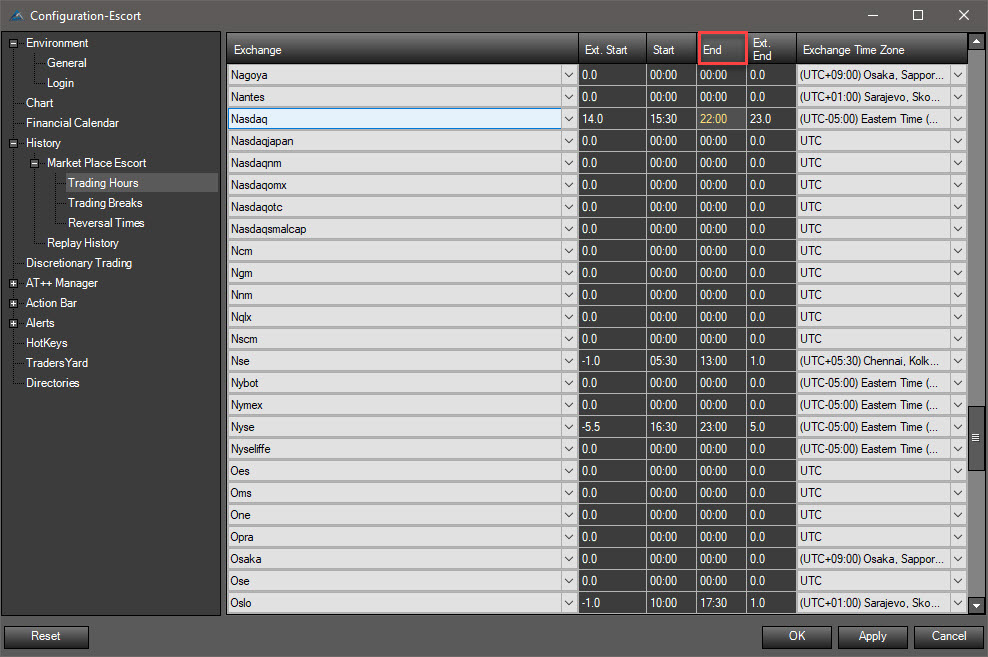
The time for the returned value will correlate with the end time of the trading session defined in the Market Escort for the exchange. The value itself can be set within the Instrument Escort and can be called up with AgenaScript using the Instrument.Exchange function.
Example
Print("The current trading session will end at " + Bars.CurrentSessionEndTime);
Bars.GetBar
Description
Bars.GetBar outputs the first bars (from oldest to newest) that correspond to the specified date/time.
See Bars.GetBarsAgo, Bars.GetByIndex, Bars.GetBarIndex.
Parameter
Type DateTime
Return Value
Type IBar Bar Object, for the bars corresponding to the timestamp
For a timestamp older than the oldest bar: 0 (null) For a timestamp younger than the newest bar: index of the last bar
Usage
Bars.GetBar(DateTime time)
More Information
For the indexing of bars please see Functionality, Bars
For more information about using DateTime see http://msdn.microsoft.com/de-de/library/system.datetime.aspx
Example
Print ("The closing price for 01.03.2012 at 18:00:00 was " + Bars.GetBar(new DateTime(2012, 01, 03, 18, 0, 0)).Close);
Bars.GetBarIndex
Description
Bars.GetBarIndex outputs the index of a bar – you can input either a bar object or a date-time object using this method.
See Bars.GetBar, Bars.GetBarsAgo, Bars.GetByIndex.
Parameter
Type IBar bar or Type DateTime
Return Value
Type int The bar index of the specified bar object or DateTime object
Usage
Bars.GetBarIndex (IBar bar)
Bars.GetBarIndex (DateTime dt)
More Information
For more information about indexing see Functionality, Bars
Example
int barsAgo = 5;
IBar bar = Bars.GetBar(Time[barsAgo]);
Print(barsAgo + " and " + Bars.GetBarIndex(bar) + " are equal in this example.");
Bars.GetBarsAgo
Description
Bars.GetBarsAgo outputs the index of the first bars (from oldest to newest) that correspond to the specified date/time.
See: Bars.GetBar, Bars.GetByIndex, Bars.GetBarIndex.
Parameter
Type DateTime
Return Value
Type int Index of the bar that corresponds to the timestamp
With a timestamp older than the oldest bar: 0 (null) With a timestamp newer than the youngest bar: index of the last bar
Usage
Bars.GetBarsAgo(DateTime time)
More Information
For more information about indexing please see Functionality, Bars
For more information about using DateTime see http://msdn.microsoft.com/de-de/library/system.datetime.aspx
Example
Print("The bar for 01.03.2012 at 18:00:00 O’clock has an index of " + Bars.GetBarsAgo(new DateTime(2012, 01, 03, 18, 0, 0)));
Bars.GetByIndex
Description
Bars.GetByIndex outputs the index for the specified bar object
See Bars.GetBar, Bars.GetBarsAgo, Bars.GetBarIndex.
Parameter
Type int Index
Return Value
Type IBar Bar object for the specified index
Usage
Bars.GetByIndex (int Index)
More Information
For indexing of bars see Functionality, Bars
Example
Print(Close[0] + " and " + Bars.GetByIndex(ProcessingBarIndex).Close + " are equal in this example.");
Bars.GetClose
Bars.GetClose(int index) – see Bars.GetOpen.
Bars.GetHigh
Bars.GetHigh(int index) – see Bars.GetOpen.
Bars.GetLow
Bars.GetLow(int index) – see Bars.GetOpen.
Bars.GetNextSessionTimeSpan
Description
Bars.GetNextSessionTimeSpan outputs the date and time for the beginning and end of a trading session.
See Bars.CurrentSessionBeginTime, Bars.CurrentSessionEndTime, Bars.NextSessionBeginTime, Bars.NextSessionEndTime.
Parameter
| DateTime | time | Date or time for which the data of the following trading session will be scanned/searched. |
| iBars | bars | Bar object for which the data will be scanned/searched. |
| int | barsago | Number of days in the past for which the data will be searched/scanned. |
Return Value
DateTime session begin DateTime session end
Note: The date for the beginning and the end of a trading session are connected components. If the specified date corresponds to the end date of the current trading session then the returned value for the beginning of a trading session may already be in the past. In this case the date for the following trading session cannot be returned.
Usage
Bars.GetNextSessionTimeSpan(Bars bars, int barsAgo, out DateTime sessionBegin, out DateTime sessionEnd)
Bars.GetNextSessionTimeSpan(DateTime time, out DateTime sessionBegin, out DateTime sessionEnd)
More Information
The two signatures will not necessarily output the same result. When using the bar signature, the supplied bar will be inspected for its session template association. The beginning and end of the next session will be taken from this template.
When using the time signature, the date and time of the supplied bar will be used to calculate the data for the current and the following sessions.
When using the time signature, a timestamp is transmitted that corresponds exactly to the beginning or the end time of a session.
More information can be found here http://msdn.microsoft.com/de-de/library/system.datetime.aspx
Example
DateTime sessionBegin;
DateTime sessionEnd;
protected override void OnCalculate()
{
Bars.GetNextSessionTimeSpan(Bars, 0, out sessionBegin, out sessionEnd);
Print("Session Start: " + sessionBegin + " Session End: " + sessionEnd);
}
Bars.GetOpen
Description
For reasons of compatibility, the following methods are available.
- Bars.GetOpen(int index) outputs the open for the bars referenced with <index>.
- Bars.GetHigh(int index) outputs the high for the bars referenced with <index>.
- Bars.GetLow(int index) outputs the low for the bars referenced with <index>.
- Bars.GetClose(int index) outputs the close for the bars referenced with <index>.
- Bars.GetTime(int index) outputs the timestamp for the bars referenced with <index>.
- Bars.GetVolume(int index) outputs the volume for the bars referenced with <index>.
Caution: The indexing will deviate from the Indexing, Bars normally used. Here, the indexing will begin with 0 for the oldest bar (on the left of the chart) and end with the newest bar on the right of the chart (=Bars.Count-1).
The indexing can easily be recalculated:
private int Convert(int idx)
{
return Math.Max(0,Bars.Count-idx-1-(CalculateOnClosedBar?1:0));
}
Parameter
int index (0 .. Bars.Count-1)
Return Value
Type double for GetOpen, GetHigh, GetLow, GetClose and GetVolume
Type DateTime for GetTime
Bars.GetSessionBegin
Description
Bars.GetSessionBegin provides the date and time of the particular session start. The date and time for the start of the current trading session are also correctly indicated when the function is called from a bar in the past. See also other Properties of bars.
Parameter
None
Return value
Type DateTime
Usage
Bars.GetSessionBegin(DateTime dt)
Further Information
The time of the returned value corresponds to the start time of the trading session. The relevant trading center which is specified in the MarketEscort. The trading place used for the value is set in the Instrumet Escort and can be determined in AgenaSript with the Instrument.Exchange function.
Example
Print("Die Handelssitzung am 25.03.2015 hat um "+ Bars.GetSessionBegin(new DateTime(2015, 03, 25)) + " begonnen.");
}
Bars.GetTime
Bars.GetTime(int index) – see Bars.GetOpen.
Bars.GetVolume
Bars.GetVolume(int index) – see Bars.GetOpen.
Bars.Instrument
Description
Bars.Instrument outputs an instrument object for the trading instrument displayed within the chart.
See Properties for more information.
Parameter
None
Return Value
Type Instrument
Usage
Bars.Instrument
More Information
For more information regarding the trading instruments please see Instruments.
Example
// both outputs will provide the same result
Print("The currently displayed trading instrument has the symbol: " + Bars.Instrument);
Instrument i = Bars.Instrument;
Print("The currently displayed trading instrument has the symbol " + i.Symbol);
Bars.IsEod
Description
Bars.IsEod can be used to check whether they are end-of-day bars.
See Properties for more information.
Parameter
None
Return Value
Type bool
Usage
Bars.IsEod
More Information
Within OnCalculate(), this property can be used without having to test for null reference. As soon as the method OnCalculate () is called by AgenaScript, there is always a bar object.
If this property used outside of OnCalculate (), then a corresponding test should be set to zero reference, e.g. With if (bars! = Null).
Example
Print("The bars are EOD: " + Bars.IsEod);
Bars.IsFalling
Description
Bar properties used when Bar is falling down.
Parameter
None
Return Value
None
Usage
Bars[0].IsFalling;
Bars.IsFirstBarInSession
Description
With Bars.IsFirstBarInSession you can determine whether the current bar is the first bar of the trading session.
See Properties of bars for more information.
Return Value
Type bool
true: The bar is the first bar of the current trading session false: The bar is not the first bar of the current trading session
Usage
Bars.IsFirstBarInSession
More Information
With OnCalculate() this property can be used without having to test for a null reference. As soon as the OnCalculate() method is called up, an object will become available. If this property is called up outside of OnCalculate() you should test for a null reference using if (Bars != null).
Example
if (Bars.IsFirstBarInSession)
Print ("The current trading session started at" + Time [0]);
Bars.isGrowing
Description
Bar properties used when Bar is growing up.
Parameter
None
Return Value
None
Usage
Bars[0].isGrowing;
Bars.IsIntraday
Description
Bars.IsIntraday returns a boolean which indicates if the TimeFrame is intra-day.
Return Value
bool
It returns "true" if TimeFrame is intra-day (e.g. 1 min, 15 min, 1 hour, etc.) and "false" in other cases.
Usage
Bars.IsIntraday
Example
if(Bars.IsIntraday) {
    Print("TimeFrame is Intraday.");
} else {
    Print("TimeFrame is not Intraday.");
}
Bars.IsNtb
Description
With Bars.IsNtb it can be checked whether it is not-time-based bars. For example Ntb bars are Point & Figure or Renko Charts.
See Properties for more information.
Parameter
None
Return Value
Type bool
Usage
Bars.IsNtb
More Information
OnCalculate() property can be used without having to test for null reference first. As soon as the method OnCalculate() is called by AgenaScript, there is always a bar object. If this property is used outside of OnCalculate(), then a corresponding test should be set to zero reference, e.g. With if (bars! = Null).
Example
Print("The bars are Ntb: " + Bars.IsNtb);
Bars.IsSessionBreak
Description
Bars.IsSessionBreak can be used to determine whether the bars are within the commercial trading session in the commercial breaks defined in the marketplace escort.
See Properties for more information.
Parameter
None
Return Value
Type bool
Usage
Bars.IsSessionBreak
More Information
Example
if (Bars.IsSessionBreak)
{
    Print("The stock exchange Xetra has just a trade pause.");
}
Bars.LastBarCompleteness
Description
Bars.LastBarCompleteness outputs the value that displays what percentage a bar has already completed. A bar with a period of 10 minutes has completed 50% after 5 minutes.
For non-time-based charts (Kagi, LineBreak, Renko, Range, P&F etc.) this will output 0 during backtesting.
Return Value
double
A percentage value; 30% will be outputted as 0.3
Usage
Bars.LastBarCompleteness
More Information
With OnCalculate() this property can be used without having to test for a null reference. As soon as the OnCalculate() method is called up by AgenaScript, the object will become available.
If this property is used outside of OnCalculate() you should test for a null reference before executing it. You can test using if (Bars != null)
Example
// A 60 minute chart is looked at from an intraday perspective
// every 5 minutes before the current bar closes
// an acoustic signal shall be played
// 55 min. equals 92%
bool remind = false;
protected override void OnCalculate()
{
if (FirstTickOfBar) remind = true;
    if (remind && Bars.LastBarCompleteness >= 0.92)
    {
    remind = false;
    PlaySound("Alert1");
    }
}
Bars.NextSessionBeginTime
Description
Bars.NextSessionBeginTime outputs the date and time for the start of the next trading session. Date and time for the next session will be correctly outputted when the function is used on a bar in the past.
Parameter
None
Return Value
Type DateTime
Usage
Bars.GetSessionNextBegin
More Information
The time for the returned value will correlate to the value displayed in the MarketEscort. The value can be set within the Instrument Escort and can be called up using the Instrument.Exchange function.
Example
Print("The next trading session starts at " + Bars.NextSessionBeginTime);
Bars.NextSessionEndTime
Description
Bars.NextSessionEndTime outputs the date and time for the end of the next session. See Properties for more information.
Parameter
None
Return Value
Type DateTime
Usage
Bars.GetSessionNextEnd
More Information
The time for the returned value will correlate with the value specified within the MarketEscort. The value itself can be set within the Instrument Escort and can be called up with AgenaScript using the Instrument.Exchange function.
Example
Print("The next trading session ends at " + Bars.NextSessionEndTime);
Bars.TailBottom
Description
With this property you are able to get the height of the bottom candle tail.
Parameter
None
Return Value
None
Usage
Bars[0].TailBottom;
Example
Print("The height of the bottom candle tail is: " + Bars.TailBottom);
Bars.TailTop
Description
With this property you are able to get the height of the top candle tail.
Parameter
None
Return Value
None
Usage
Bars[0].TailTop;
Example
Print("The height of the top candle tail is: " + Bars.TailTop);
Bars.TicksCountForLastBar
Description
Bars.TicksCountForLastBar outputs the total numbers of ticks contained within a bar.
More information can be found in Properties of bars.
Parameter
None
Return Value
Type int
Usage
Bars.TicksCountForLastBar
More Information
With OnCalculate() this property can be used without having to test for a null reference. As soon as the OnCalculate() method is called up by AgenaScript, the object will become available.
If this property is used outside of OnCalculate(), you should test for a null reference before executing it. You can test using if (Bars != null)
Example
Print("The current bar consists of " + Bars.TicksCountForLastBar + " Ticks.");
Bars.TicksCountInTotal
Description
Bars.TicksCountInTotal outputs the total number of ticks from the moment the function is called up.
More information can be found here: Properties.
Parameter
None
Return Value
Type int
Usage
Bars.TicksCountInTotal
More Information
The data type int has a positive value range of 2147483647. When you assume 10 ticks per second, there will be no overlaps within 2 trading months with a daily runtime of 24 hours.
With OnCalculate() this property can be used without having to test for a null reference. As soon as the OnCalculate() method is called up by AgenaScript, the object will become available.
If this property is used outside of OnCalculate(), you should test for a null reference before executing it. You can test using if (Bars != null)
Example
**Print**("The total amount of ticks is " + Bars.TicksCountInTotal);
Bars.TimeFrame
Description
Bars.TimeFrame outputs the timeframe object containing information regarding the currently used timeframe.
More information can be found here: Properties
Parameter
None
Return Value
Type ITimeFrame
Usage
Bars.TimeFrame
More Information
For more information about timeframe objects please see TimeFrame.
With OnCalculate() this property can be used without having to test for a null reference. As soon as the OnCalculate() method is called up by AgenaScript, the object will become available.
If this property is used outside of OnCalculate(),you should test for a null reference before executing it. You can test using if (Bars != null)
Example
//Usage within a 30 minute chart
TimeFrame tf = (TimeFrame) Bars.TimeFrame;
Print(Bars.TimeFrame); // outputs "30 Min"
Print(tf.Periodicity); // outputs "Minute"
Print(tf.PeriodicityValue); // outputs "30"
BarsCountForSession
Description
Bars.BarsCountForSession outputs the amount of bars that have occurred since the beginning of the current trading session.
See further Properties of bars.
Return Value
Type int Amount of Bars
A value of -1 indicates a problem with referencing the correct session beginning.
Usage
Bars.BarsCountForSession
Further Information
Within OnCalculate() this property can be used without having to test for a null reference. As soon as the OnCalculate() method is called up by AgenaScript, the object will become available.
If this property is used outside of OnCalculate() then you should test for a null reference before executing it. You can test using if (Bars!= null) .
Example
Print ("Since the start of the last trading session there have been" + Bars.BarsCountForSession + "bars.");
ProcessingBarIndexLast
Description
Indicates if current bar is last in calculation.
Parameter
none
Return value
Type bool
Usage
ProcessingBarIndexLast
More Information
used for complicated calculation on a last bar
Example
protected override void OnCalculate()
        {
            base.OnCalculate();
            if (!IsProcessingBarIndexLast)
                return;
            bool isUpdated;
}
Collections
ChartDrawings
Description
ChartDrawings is a collection containing all drawing objects within the chart. The property hold all drawings which were generated by the script. The index for ChartDrawings is the explicit name for the drawing object (string tag).
Usage
ChartDrawings [string tag]
Example
Note: To be able to use the interface definitions you must use the using method.
using AgenaTrader.Plugins;
// Output number of drawing objects within the chart and their tags
Print("The chart contains " + ChartDrawings.Count + " drawing objects.");
for each (IDrawObject draw in ChartDrawings) Print(draw.Tag);
//Draw a black trend line...
AddChartLine("MyLine", true, 10, Close[10], 0, Close[0], Color.Black, DashStyle.Solid, 3);
// ... and change the color to red
ITrendLine line = (ITrendLine) ChartDrawings["MyLine"];
if (line != null) line.Pen.Color = Color.Red;
// Set all lines within the chart to a line strength of 3,
// and lock it so that it cannot be edited or moved
foreach (IDrawObject draw in ChartDrawings)
if (draw is IVerticalLine)
{
IVerticalLine vline = (IVerticalLine) draw;
vline.IsLocked = true;
vline.Editable = false;
vline.Pen.Width = 3;
}
InSeries
Description
InSeries is a DataSeries object in which the input data for an indicator or strategy is stored.
If the indicator is used without any explicit instructions for the input data, then the closing price for the current market prices will be used.
When calling up the SMA(20) the smoothing average is calculated on the basis of the closing prices for the current chart price data (this is equivalent to SMA(close,20).
InSeries[0] = Close[0].
When calling up the SMA(high, 20) the high price values are loaded and used for the calculation of the smoothing average.
InSeries[0] = High[0].
This way you can select which data series should be used for the calculation of the indicator.
double d = RSI(SMA(20), 14, 3)[0]; calculates the 14 period RSI using the SMA(20) as the input data series. InSeries[0] = SMA(20)[0].
Usage
InSeries
InSeries[int barsAgo]
Example
Print("The input data for the indicators are " + Input[0]);
Lines
Description
Lines is a collection that contains all LevelLine objects of an indicator.
When a line object is added to the indicator using the Add() method, this line is automatically added to the "lines" collection.
The order of the add commands determines how these lines are sorted. The first information request of Add() will create Lines[0], the next information request will be Lines[1] etc.
See OutputDescriptor.
Usage
Lines[int index]
Example
// Add "using System.Drawing.Drawing2D;" for DashStyle
protected override void OnInit()
{
Add(new LevelLine(Color.Blue, 70, "Upper")); // saves into Lines[0]
Add(new LevelLine(Color.Blue, 30, "Lower")); // saves into Lines[1]
}
protected override void OnCalculate()
{
// When the RSI is above 70, properties of the lines will be changed
if (RSI(14 ,3)[0] >= 70)
{
    Lines[0].Width = 3;
    Lines[0].Color = Color.Red;
    Lines[0].DashStyle = DashStyle.Dot;
}
else
{
    Lines[0].Width = 1;
    Lines[0].Color = Color.Blue;
    Lines[0].DashStyle = DashStyle.Solid;
}
}
PlotColors
Description
PlotColors is a collection that contains all color series of all plot objects.
When a plot is added using the Add() method it automatically creates a color series object and is added to the PlotColors collection.
The order of the add commands determines how the plot colors are sorted. The first information request of Add() will create PlotColors[0], the following information request will create PlotColors[1] etc.
Usage
PlotColors[int PlotIndex][int barsAgo]
More Information
More information regarding the collection class: http://msdn.microsoft.com/en-us/library/ybcx56wz%28v=vs.80%29.aspx
Example
using System;
using System.Collections.Generic;
using System.ComponentModel;
using System.Drawing;
using AgenaTrader.API;
namespace AgenaTrader.UserCode
{
[Description("PlotColor Demo")]
public class PlotColorsDemo : UserIndicator
{
public DataSeries SMA20 { get {return Outputs[0];} }
public DataSeries SMA50 { get {return Outputs[1];} }
public DataSeries SMA100 { get {return Outputs[2];} }
private Pen pen;
protected override void OnInit()
{
// Set line strength (width) to 4
pen = new Pen(Color.Empty, 4);
// Add three plots with the defined line strength to the chart
Add(new OutputDescriptor(pen, OutputSeriesDisplayStyle.LevelLine, "SMA20" )); //attached to PlotColors[0]
Add(new OutputDescriptor(pen, OutputSeriesDisplayStyle.LevelLine, "SMA50" )); //attached to PlotColors[1]
Add(new OutputDescriptor(pen, OutputSeriesDisplayStyle.LevelLine, "SMA100")); //attached to PlotColors[2]
IsOverlay = true;
}
protected override void OnCalculate()
{
// Add values to the three plots
SMA20.Set (SMA(20) [0]);
SMA50.Set (SMA(50) [0]);
SMA100.Set(SMA(100)[0]);
// Change colors depending on the trend
if (IsSerieRising(Close))
{
    PlotColors[0][0] = Color.LightGreen;
    PlotColors[1][0] = Color.Green;
    PlotColors[2][0] = Color.DarkGreen;
}
else if (IsSerieFalling(Close))
{
    PlotColors[0][0] = Color.LightSalmon;
    PlotColors[1][0] = Color.Red;
    PlotColors[2][0] = Color.DarkRed;
}
else
{
    PlotColors[0][0] = Color.LightGray;
    PlotColors[1][0] = Color.Gray;
    PlotColors[2][0] = Color.DarkGray;
}
}
}
}
OutputDescriptor
Description
OutputDescriptor is a collection that contains the plot objects of an indicator.
When a plot object is added to an indicator using the Add() method, it is also automatically added to the "plots" collection.
The order of the add commands determines how the plots are sorted. The first Add() information request will create Plots[0], the following information request will create OutputDescriptor[1] etc.
See Lines.
Usage
OutputDescriptor[int index]
Example
protected override void OnInit()
{
    Add(new OutputDescriptor(Color.FromKnownColor(KnownColor.Blue), "MySMA 20")); // saved to OutputDescriptor[0]
}
protected override void OnCalculate()
{
Value.Set(SMA(20)[0]);
// If the market price is above the SMA colorize it green, otherwise red
if (Close[0] > SMA(20)[0])
    OutputDescriptor[0].PlotColor = Color.Green;
else
    OutputDescriptor[0].PlotColor = Color.Red;
}
Values
Description
Values is a collection that contains the data series objects of an indicator.
When a plot is added to an indicator using the Add() method, a value object is automatically created and added to the "values" collection.
The order of the add commands determines how the values are sorted. The first information request will create Values[0], the next information request will create Values[1] etc.
Value is always identical to Values[0].
Usage
Outputs[int index]
Outputs[int index][int barsAgo]
More Information
The methods known for a collection, Set() Reset() and Count(), are applicable for values.
Information on the class collection: http://msdn.microsoft.com/en-us/library/ybcx56wz%28v=vs.80%29.aspx
Example
// Check the second indicator value of one bar ago and set the value of the current indicator value based on it.
if (Instrument.Compare(Outputs[1][1], High[0] - Low[0]) < 0)
    Value.Set(High[0] - Low[0]);
else
    Value.Set(High[0] - Close[0]);
Data Series
Description
Data series are interpreted as freely usable data storage containers for your programs. Additionally, they an integrated component of AgenaTrader that saves the price changes for individual bars. We will be focusing on the latter function here. In the following section, the concept of data series will be explained in detail and understandably. All price data for the individual bars are organized and saved within data series. The following are available:
Open
Description
Open is a DataSeries of the type DataSeries, in which the historical opening prices are saved.
Parameter
BarsAgo Index Value (see Bars)
Usage
Open
Open[int barsAgo]
More Information
The returned value is dependent upon the property of CalculateOnClosedBar.
Example
// Opening price for the current period
Print(Time[0] + " " + Open[0]);
// Opening price for the bars of 5 periods ago
Print(Time[5] + " " + Open[5]);
// Current value for the SMA 14 that is based on the opening prices (rounded)
Print("SMA(14) calculated using the opening prices: " + Instrument.Round2TickSize(SMA(Open, 14)[0]));
Opens
Description
Opens is an array of data series that contains all open data series.
This array is only useful or meaningful for indicators or strategies that use multiple data from multiple timeframes. A new entry is entered into the array whenever a new timeframe is added to an indicator or strategy.
With [TimeFrameRequirements(("1 Day"), ("1 Week"))] the array will contain 3 entries:
Opens[0] The open data series of the chart timeframe Opens[1] The open data series of all bars in a daily timeframe Opens[2] The open data series of all bars in a weekly timeframe
Opens[0][0] is equivalent to Open[0].
In addition, please see MultiBars for more information.
Parameter
barsAgo Index value for the individual bars within the data series (see Bars) barSeriesIndex Index value for the various timeframes
Usage
Opens[int barSeriesIndex]
Opens[int barSeriesIndex][int barsAgo]
More Information
The returned value is dependent upon the property of CalculateOnClosedBar.
Example
See example: Multibars.
High
Description
High is a Data Series of the type Data Series, in which the historical high prices are saved.
Parameter
barsAgo IndexValue (see Bars)
Usage
High
High[int barsAgo]
More Information
The returned value is dependent upon the property of CalculateOnClosedBar.
Example
// High values of the current period
Print(Time[0] + " " + High[0]);
// High values of the bar from 5 periods ago
Print(Time[5] + " " + High[5]);
// the current value for the SMA 14 calculated on the basis of the high prices
Print("SMA(14) Calculated using the high prices: " + Instrument.Round2TickSize(SMA(High, 14)[0]));
Highs
Description
Highs is an array of [DataSeries][1] that contains all high data series.
This array is only of value for indicators or strategies that use data from multiple timeframes.
A new entry is added to the array whenever a new time unit is added to an indicator or strategy.
With [TimeFrameRequirements(("1 Day"), ("1 Week"))] the array will contain 3 entries:
Highs[0] the high data series of the chart timeframe Highs[1] the high data series of all bars in a daily timeframe Highs[2] the high data series of all bars in a weekly timeframe
Highs[0][0] is equivalent to High[0].
See MultiBars.
Parameter
barsAgo Index value for the individual bars within the data series (see Bars) barSeriesIndex Index value for the various timeframes
Usage
Highs[int barSeriesIndex]
Highs[int barSeriesIndex][int barsAgo]
More Information
The returned value is dependent upon the property of CalculateOnClosedBar.
Example
Please see examples under Multibars.
Low
Description
Low is a DataSeries of the type DataSeries, in which the historical low prices are saved.
Parameter
barsAgo IndexValue (see Bars)
Usage
Low
Low[int barsAgo]
More Information
The returned value is dependent upon the property of CalculateOnClosedBar.
Example
// Lowest value of the current period
Print(Time[0] + " " + Low[0]);
// Lowest value of the bar from 5 periods ago
Print(Time[5] + " " + Low[5]);
// The current value for the SMA 14 calculated on the basis of the low prices (smoothed)
Print("SMA(14) calculated using the high prices: " + Instrument.Round2TickSize(SMA(Low, 14)[0]));
Lows
Description
Lows is an array of [DataSeries][1] that contains all Low data series.
This array is only of value to indicators or strategies that use data from multiple time units.
A new entry is added whenever a new time unit is added to an indicator or strategy.
With [TimeFrameRequirements(("1 Day"), ("1 Week"))] the array will contain 3 entries:
Lows[0] the low data series for the chart timeframe Lows[1] the low data series for all bars in a daily timeframe Lows[2] the low data series for all bars in a weekly timeframe
Lows[0][0] is equivalent to Low[0].
See MultiBars.
Parameter
barsAgo Index value for the individual bars within the data series barSeriesIndex Index value for the various timeframes
Usage
Lows[int barSeriesIndex]
Lows[int barSeriesIndex][int barsAgo]
More Information
The returned value is dependent upon the property CalculateOnClosedBar.
Example
See example Multibars.
Close
Description
Close is a DataSeries of the type DataSeries, in which the historical closing prices are saved.
Parameter
barsAgo Index value (see Bars)
Usage
Close
Close[int barsAgo]
More Information
The returned value is dependent upon the property CalculateOnClosedBar.
Indicators are usually calculated using the closing prices.
Example
// Closing price of the current period
Print(Time[0] + " " + Close[0]);
// Closing price of the bar from 5 periods ago
Print(Time[5] + " " + Close[5]);
// Current value for the SMA 14 based on the closing prices
Print("SMA(14) calculated using the closing prices: " + Instrument.Round2TickSize(SMA(Close, 14)[0]));
// Close does not need to be mentioned since it is used by default
Print("SMA(14) calculated using the closing prices: " + Instrument.Round2TickSize(SMA(14)[0]));
Closes
Description
Closes is an array of [DataSeries][1] that contains all Low data series.
This array is only of importance to indicators or strategies that use data from multiple time units.
A new entry is added to the array whenever a timeframe is added to an indicator or strategy.
With [TimeFrameRequirements(("1 Day"), ("1 Week"))] the array will contain 3 entries:
Closes[0] the close data series of the chart timeframe Closes[1] the close data series of all bars in a daily timeframe Closes[2] the close data series of all bars in a weekly timeframe
Closes[0][0] is equivalent to Close[0].
See MultiBars.
Parameter
barsAgo Index value of the individual bars within the data series barSeriesIndex Index value for the various timeframes
Usage
Closes[int barSeriesIndex]
Closes[int barSeriesIndex][int barsAgo]
More Information
The returned value is dependent upon the property CalculateOnClosedBar.
Example
See example Multibars.
Median
Description
Median is a DataSeries of the type DataSeries, in which the historical median values are saved.
The median price of a bar is calculated using (high + low) / 2
Parameter
barsAgo Index value (see Bars)
Usage
Median
Median[int barsAgo]
More Information
The returned value is dependent upon the property CalculateOnClosedBar.
Further information about median, typical und weighted: http://blog.nobletrading.com/2009/12/median-price-typical-price-weighted.html
Example
// Median price for the current period
Print(Time[0] + " " + Median[0]);
// Median price of the bar from 5 periods ago
Print(Time[5] + " " + Median[5]);
// Current value for the SMA 14 calculated using the median prices
Print("SMA(14) calculated using the median prices: " + Instrument.Round2TickSize(SMA(Median, 14)[0]));
Medians
Description
Medians is an array of [DataSeries][1] that contains all Median data series.
This array is only of value to indicators or strategies that use data from multiple timeframes.
A new entry is added to the array whenever a new time frame is added to an indicator or strategy.
With [TimeFrameRequirements(("1 Day"), ("1 Week"))] the array will contain 3 entries:
Medians[0] the median data series of the chart timeframe Medians[1] the median data series of all bars in a daily timeframe Medians[2] the median data series of all bars in a weekly timeframe
Medians[0][0] is equivalent to Medians[0].
See MultiBars.
Parameter
barsAgo Index value for the individual bars within a data series barSeriesIndex Index value for the various timeframes
Usage
Medians[int barSeriesIndex]
Medians[int barSeriesIndex][int barsAgo]
More Information
The returned value is dependent upon the property CalculateOnClosedBar.
Further information on median: http://www.investopedia.com/terms/m/median.asp
Example
See example in Multibars.
Typical
Description
Typical is a DataSeries of the type DataSeries, in which the historical typical values are saved.
The typical price of a bar is calculated using (high + low + close) / 3.
Parameter
barsAgo Index value (see Bars)
Usage
Typical
Typical[int barsAgo]
More Information
The returned value is dependent upon the property CalculateOnClosedBar.
Further information on typical: https://technicianapp.com/resources/typical-price/
Example
// Typical price for the current period
Print(Time[0] + " " + Typical[0]);
// Typical price of the bar from 5 periods ago
Print(Time[5] + " " + Typical[5]);
// Current value for the SMA 14 calculated using the typical price
Print("SMA(14) calculated using the typical price: " + Instrument.Round2TickSize(SMA(Typical, 14)[0]));
Typicals
Description
Typicals is an array of DataSeries that contains all Typical data series.
This array is only of value to indicators and strategies that make use of multiple timeframes.
A new entry is added to the array whenever a new timeframe is added to an indicator or strategy.
With [TimeFrameRequirements(("1 Day"), ("1 Week"))] the array will contain 3 entries:
Typicals[0] the typical data series of the chart timeframe Typicals[1] the typical data series of all bars in a daily timeframe Typicals[2] the typical data series of all bars in a weekly timeframe
Typicals[0][0] is equivalent to Typicals[0].
See MultiBars.
Parameter
barsAgo Index value of the individual bars within a data series barSeriesIndex Index value of the various timeframes
Usage
Typicals[int barSeriesIndex]
Typicals[int barSeriesIndex][int barsAgo]
More Information
The returned value is dependent upon the property CalculateOnClosedBar.
Example
See example Multibars.
Weighted
Description
Weighted is a DataSeries of the type DataSeries, in which the historical weighted values are saved.
The weighted price of a bar is calculated using the formula (high + low + 2*close) / 4 and then weighted on the closing price.
Parameter
barsAgo Index value (see Bars)
Usage
Weighted
Weighted[int barsAgo]
More Information
The returned value is dependent upon the property CalculateOnClosedBar.
Information regarding weighted: http://www.stock-trading-infocentre.com/pivot-points.html
Example
// Weighted price for the current period
Print(Time[0] + " " + Weighted[0]);
// Weighted price of the bar from 5 periods ago
Print(Time[5] + " " + Weighted[5]);
// Current value for the SMA 14 using the weighted price
Print("SMA(14) calculated using the weighted price: " + Instrument.Round2TickSize(SMA(Weighted, 14)[0]));
Weighteds
Description
Weighteds is an array of [DataSeries][1] that contains all Weighted data series.
The array is only of value for indicators and strategies that use data from multiple timeframes.
A new entry is added to the array whenever a new timeframe is added to an indicator or strategy.
With [TimeFrameRequirements(("1 Day"), ("1 Week"))] the array will contain 3 entries:
Weighteds[0] the weighted data series of the chart timeframe Weighteds[1] the weighted data series of all bars in a daily timeframe Weighteds[2] the weighted data series of all bars in a weekly timeframe
Weighteds[0][0] is equivalent to Weighteds[0].
See MultiBars.
Parameter
barsAgo Index value of the individual bars within a data series barSeriesIndex Index value for the various timeframes
Usage
Weighteds[int barSeriesIndex]
Weighteds[int barSeriesIndex][int barsAgo]
More Information
The returned value is dependent upon the property CalculateOnClosedBar.
Example
See example under Multibars.
Time
Description
Time is a DataSeries of the type DateTimeSeries, in which the timestamps of the individual bars are saved.
Parameter
barsAgo Index value (see Bars)
Usage
Time
Time[int barsAgo]
More Information
The returned value is dependent upon the property CalculateOnClosedBar.
Example
// Timestamp of the current period
Print(Time[0]);
// Timestamp of the bar from 5 periods ago
Print(Time[5]);
Times
Description
Times is an array of DataSeries that contains all Time data series.
This array is only of value to indicators and strategies that make use of multiple timeframes. A new entry is added to the array whenever a new timeframe is added to an indicator or strategy.
With [TimeFrameRequirements(("1 Day"), ("1 Week"))] the array will contain 3 entries:
Times[0] the time data series of the chart timeframe Times[1] the time data series of all bars in a daily timeframe Times[2] the time data series of all bars in a weekly timeframe
Times[0][0] is equivalent to Times[0].
See MultiBars.
Parameter
barsAgo Index value for the individual bars within a data series barSeriesIndex Index value for the various timeframes
Usage
Times[int barSeriesIndex]
Times[int barSeriesIndex][int barsAgo]
More Information
The returned value is dependent upon the property CalculateOnClosedBar.
Example
See example Multibars.
Volume
Description
Volume is a DataSeries of the type DataSeries, in which the historical volume information is saved.
Parameter
barsAgo Index value (see Bars)
Usage
Volume
Volume[int barsAgo]
More Information
The returned value is dependent upon the property CalculateOnClosedBar.
The value returned by the VOL() indicator is identical with the volume described here; for example, Vol()[3] will have the same value as Volume[3].
Example
// Volume for the current period
Print(Time[0] + " " + Volume[0]);
// Volume of the bar from 5 periods ago
Print(Time[5] + " " + Volume[5]);
// Current value for the SMA 14 calculated using the volume
Print("SMA(14) calculated using the volume: " + Instrument.Round2TickSize(SMA(Volume, 14)[0]));
Volumes
Description
Volumes is an array of DataSeries that contains all Volume data series.
This array is only of value for indicators or strategies that use data from multiple timeframes.
A new entry is added to the array whenever a new timeframe is added to an indicator or strategy.
With [TimeFrameRequirements(("1 Day"), ("1 Week"))] the array will contain 3 entries:
Volumes[0] the volume data series of the chart timeframe Volumes[1] the volume data series of all bars in the daily timeframe Volumes[2] the volume data series of all bars in the weekly timeframe
Volumes[0][0] is equivalent to Volumes[0].
See MultiBars.
Parameter
barsAgo Index value of the individual bars within a data series
barSeriesIndex Index value of the various timeframes
Usage
Volumes[int barSeriesIndex]
Volumes[int barSeriesIndex][int barsAgo]
More Information
The returned value is dependent upon the property CalculateOnClosedBar.
Example
See example Multibars.
TimeFrame
Description
TimeFrame is a timeframe object. This property is used to read the current TimeFrame and not to set it.
Usage
TimeFrame
TimeFrames
Description
TimeFrames is an array of timeframe objects that contains a timeframe object for each individual bar object.
This array is only of value for indicators or strategies that use data from multiple timeframes.
A new entry is added to the array whenever a new timeframe is added to an indicator or strategy.
With [TimeFrameRequirements(("1 Day"), ("1 Week"))] the array will contain 3 entries:
TimeFrames [0] Timeframe of the primary data series (chart timeframe) TimeFrames [1] Print(TimeFrames[1]); // returns "1 Day" TimeFrames [2] Print(TimeFrames[2]); // returns "1 Week"
TimeFrames [0] is equivalent to TimeFrame.
See MultiBars.
Parameter
barSeriesIndex Index value for the various timeframes
Usage
TimeFrames [int barSeriesIndex]
Example
if (ProcessingBarSeriesIndex == 0 && ProcessingBarIndex == 0)
for (int i = BarsArray.Count-1; i >= 0; i--)
Print("The Indicator " + this.Name + " uses Bars of the Timeframe " + TimeFrames[i]);
Instruments
The term "instrument" denotes a tradable value such as a stock, ETF, future etc.
An instrument has various properties that can be used in AgenaScripts created by the user:
With the OnCalculate() method you can use any properties you wish without having to test for a null reference. As soon as the OnCalculate() function is called up by AgenaScript, an object will become available. If you wish to use these properties outside of OnCalculate(), you should first perform a test for null references using if (Bars != null)
Instrument.Compare
Description
The Instrument.Compare function compares two market prices whilst taking into account the correct number of decimal points. The smallest possible price change is displayed by the value TickSize. This function simplifies the otherwise time-consuming comparison using floating-point operations.
Parameter
double value1 double value2
Return value
Type int
1 - value1 is bigger than value2 -1 - value1 is smaller than value2 0 - value1 and value2 are equal
Usage
Instrument.Compare(double Value1, double Value2)
More Information
Be aware this function compares prices based on TickSize. If the ticksize of your instrument is 0.01 these prices will be rounded and compared on 2 decimal digits. If you want a regular comparation of two numbers, you should use the operator "greater than" (>) or the operator "smaller than" (<).
More infomation about math.round()
If the tick size is 0,00001 – as it usually is with FX values – then the following will be displayed:
Compare(2, 1.99999) a 1, meaning 2 is bigger than 1.99999 Compare(2, 2.000001) a 0, meaning the values are equal Compare(2, 1.999999) a 0, meaning the values are equal Compare(2, 2.00001) a -1, meaning 2 is smaller than 2.00001
Example
Print(Instrument.Compare(2, 1.999999));
Instrument.Currency
Description
Instrument.Currency outputs a currency object that contains the corresponding currency in which the instrument is traded.
Parameter
None
Return Value
A constant of the type "public enum currencies"
Usage
Instrument.Currency
More Information
The common currencies are: AUD, CAD, EUR, GBP, JPY or USD.
Example
Print(Instrument.Name + " is traded in " + Instrument.Currency);
Instrument.Digits
Description
Instrument.Digits outputs the number of decimal points in which the market price of the instrument is traded.
Parameter
none
Return Value
int Digits
Usage
Instrument.Digits
More Information
Stocks are usually traded to two decimal points. Forex can be traded (depending on the data provider) with 4 or 5 decimal places.
This function is especially useful when formatting the output of various instruments that need rounding. Also see TickSize and Instrument.Round2Ticks, Instrument.Round2TickSize.
More information can be found here: Formatting of Numbers.
Example
Print("The value of " +Instrument.Name + " is noted with a precision of " + Instrument.Digits +" Decimal points.");
Instrument.ETF
Description
Instrument.ETF is used to differentiate between a stock and an ETF. This is necessary since ETFs are considered to be „stocks" by some exchanges.
Parameter
none
Return Value
Type bool
Usage
Instrument.ETF
More Information
What is an ETF?
Wikipedia: http://de.wikipedia.org/wiki/Exchange-traded_fund
Example
if (Instrument.InstrumentType == InstrumentType.Stock)
if (Instrument.ETF)
Print("The value is an ETF.");
else
Print("The value is a stock.");
Instrument.Exchange
Description
Instrument.Exchange outputs the description/definition of the current exchange for the current instrument.
Parameter
none
Return Value
An exchange object of the type "public enum exchanges"
Usage
Instrument.Exchange
More Information
An overview of various exchange: https://en.wikipedia.org/wiki/List_of_stock_exchanges
Example
Print("The instrument " + Instrument.Name +" is traded on the " + Instrument.Exchange + " exchange.");
Instrument.Expiry
Description
Instrument.Expiry outputs the date (month and year) of the expiry of a financial instrument. Only derivative instruments such as options or futures will have an expiry date.
Parameter
None
Return Value
Type DateTime
For instruments without an expiry date the returned value is set to DateTime.MaxValue(= 31.12.9999 23.59:59)
Usage
Instrument.Expiry
More Information
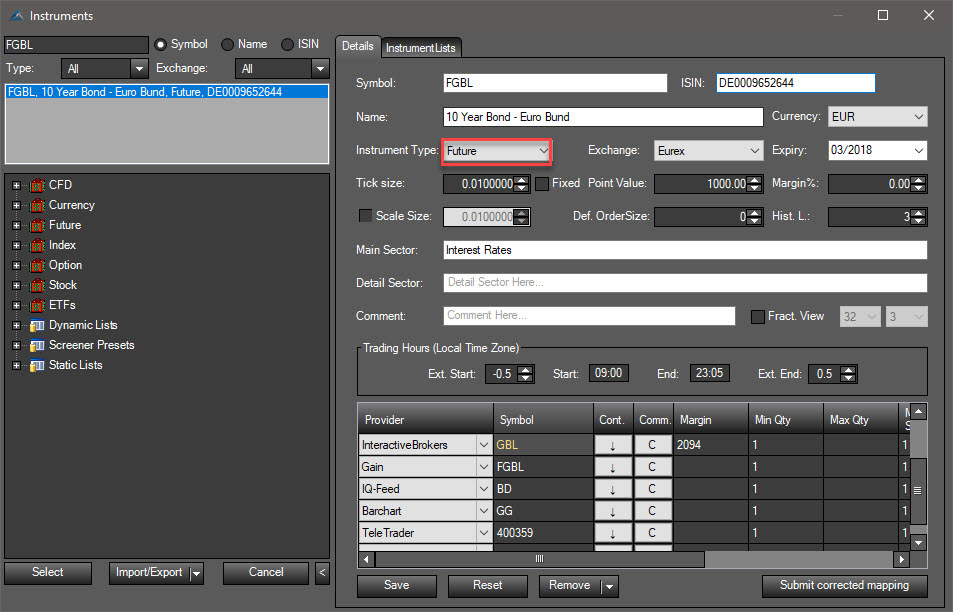
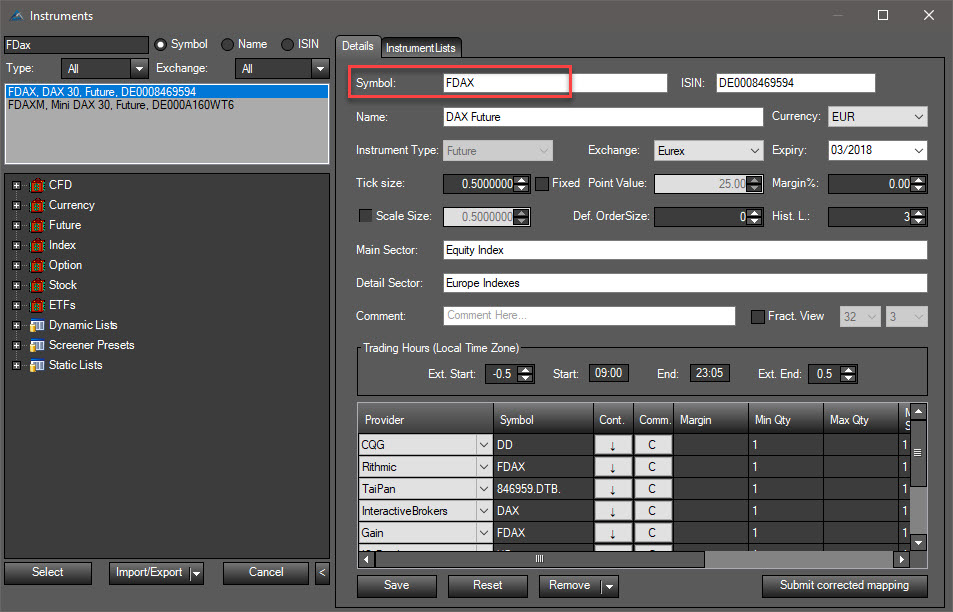
The expiry date (expiry) can also be seen within the Instrument Escort:
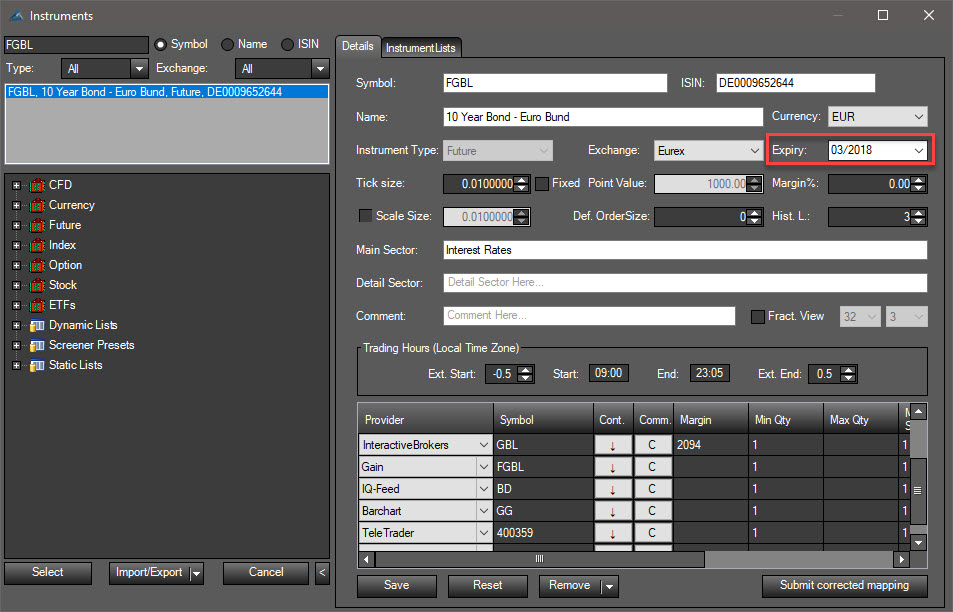
Example
Print("The instrument " + Instrument.Name +" will expire on " + Instrument.Expiry);
Instrument.GetCurrencyFactor
Description
Instrument.GetCurrencyFactor returns a conversion factor that can be used to convert an instrument's currency to the account's currency.
Parameter
Type Currencies
Return Value
Type double
Usage
Instrument.GetCurrencyFactor(Currencies)
More Information
Common currencies are.B. AUD, CAD, EUR, GBP, JPY oder USD.
Example
Protected override void OnCalculate()
{
   double currFactor = Instrument.GetCurrencyFactor(Account.Currency);
   Print(Close[0] + " in " + Instrument.Currency.ToString() + " = " + (Close[0] * currFactor) + " in " + Account.Currency.ToString());
}
Instrument.InstrumentType
Description
Instrument.InstrumentType outputs a type object of the trading instrument.
Parameter
none
Return Value
Object of the type "public enum instrument"
Usage
Instrument.InstrumentType
More Information
Potential values are: future, stock, index, currency, option, CFD and unknown.
There is no ETF type. ETFs are considered to be of the type "stock" – see Instrument.ETF.
The instrument type can also be viewed within the Instrument Escort:
Example
Print("The instrument " + Instrument.Name + " is of the type " + Instrument.InstrumentType);
Instrument.MainSector
Description
Instrument.MainSector returns the main sector of the trading instrument.
Parameter
none
Return Value
String
Usage
Instrument.MainSector
More Information
The main sector is also visible in the instrument escort:
Example
Print("Das Instrument " + Instrument.Name + " ist im Sektor " + Instrument.MainSector + " tätig.");
Instrument.Margin
Description
Instrument.MainSector returns the required margin of the trading instrument.
Parameter
none
Return Value
int
Usage
Instrument.Margin
More Information
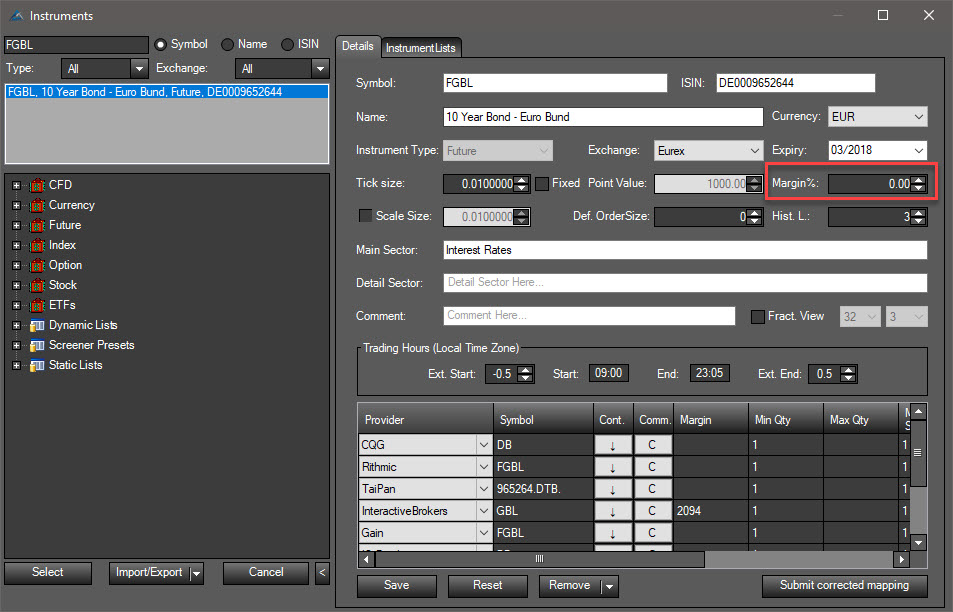
Margin is also visible in the instrument escort:
Example
Print("Das Instrument " + Instrument.Name + " has a margin of " + Instrument.Margin);
Instrument.Name
Description
Instrument.Name outputs the name/description of the trading instrument.
Parameter
none
Return Value
Type string
Usage
Instrument.Name
More Information
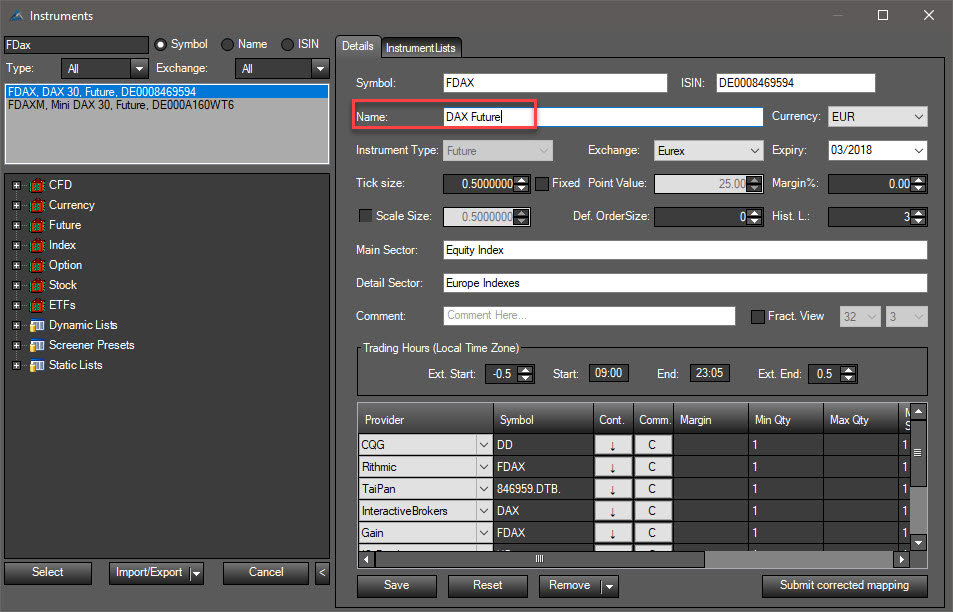
The instrument name can also be seen within the Instrument Escort:
Example
Print("The currently loaded instrument inside the chart is named " + Instrument.Name);
Instrument.PointValue
Description
Instrument.PointValue outputs the monetary value for a full point movement of the instrument.
Parameter
none
Return Value
double – point value
Usage
Instrument.PointValue
More Information
Example for various point values (per amount, CFD, futures contract, lot etc.)
Stock: generally 1.00 Euro or 1.00 USD. EUR/USD: 100,000 USD DAX future: 25.00 Euro
Tick Value
The tick value can be calculated by multiplying the point value with the tick size.
For example, the E-mini S&P 500 has a point value of $50. The tick size equals 0.25. This means that there are 4 ticks in one full point for the E-mini S&P 500. Since 50 * 0.25 = 50/4 this means that the tick value is $12.50.
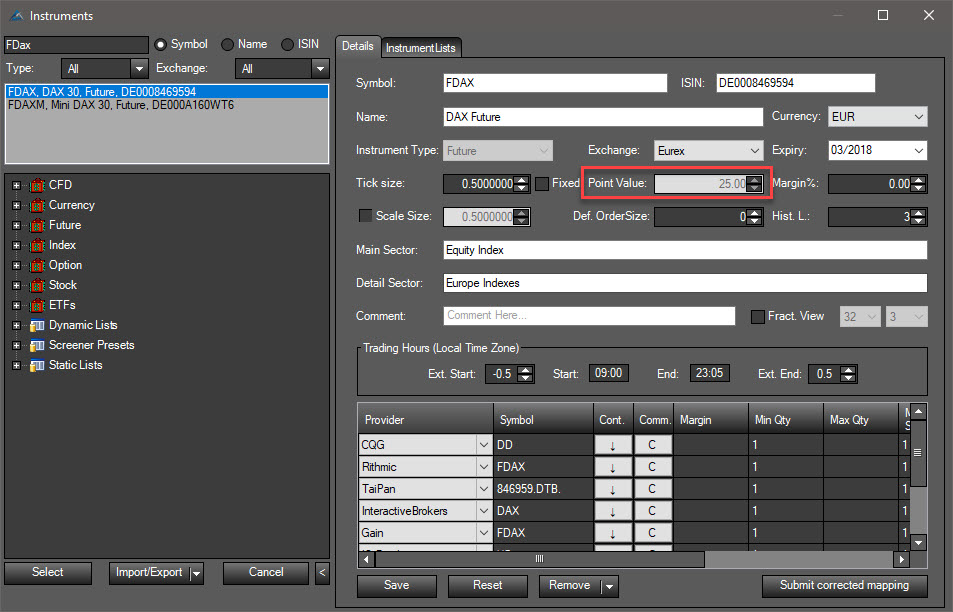
The point value can also be viewed within the Instrument Escort:
Example
Print("When " + Instrument.Name + " rises for one full point then this is equal to " + Instrument.PointValue + " " + Instrument.Currency);
Instrument.Round2TickSize
Description
The function Instrument.Round2TickSize rounds the supplied market price to the smallest value divisible by the tick size of the instrument.
Parameter
double – market value
Return value
double
Usage
Instrument.Round2TickSize(double MarketPrice)
More Information
The number of decimal places to which the price is rounded depends on the instrument. If, for example, an instrument is a stock, then the rounding will be performed to 2 decimal places. For a Forex instrument, it may be carried out to 4 or 5 decimal places.
See TickSize and Instrument.Digits.
Example of professional Formatting, Formatting of Numbers.
Example
double Price = 12.3456789;
Print(Price + " rounded for a " + Instrument.Name + " valid value is " + Instrument.Round2TickSize(Price));
Instrument.Symbol
Description
Instrument.Symbol outputs the symbol that identifies the trading instrument within AgenaTrader. Depending on the symbol, the mappings for the various data feed providers and brokers will be managed in different ways.
Parameter
none
Return value
Type string
Usage
Instrument.Symbol
More Information
By using symbols, identical stocks being traded on different exchanges can be identified and separated from each other. The symbol BMW.DE is the BMW stock on the XETRA exchange. BMW.CFG is the CFD for the BMW stock.
The instrument symbol can also be viewed within the Instrument Escort:
Example
Print("The instrument currently loaded within the chart has the symbol: " + Instrument.Symbol);
Instrument.TickSize
Description
The tick size is the smallest measurable unit that a financial instrument can move. This is usually called 1 tick.
Parameter
none
Return Value
double
Usage
Instrument.TickSize or simply TickSize
More Information
The keyword TickSize is equivalent to Instrument.TickSize. Both information requests will produce the same value and are thus interchangeable.
Example
Stock: 0.01 ES future: 0.25 EUR/USD: 0.00001
See Instrument.PointValue and Instrument.Digits.
Examples of professional Formatting, Formatting of Numbers.
Example
Print("The value of " + Instrument.Name + " can change for a minimum of " + Instrument.TickSize + " Tick(s).");
Multibars
Description
An indicator or a strategy will always have the same underlying timeframe-units as those units being displayed within the chart. The values of an SMA(14) indicator displayed in a 5 minute chart will be calculated based on the last fourteen 5 minute bars. A daily chart, on the other hand, would use the closing prices of the past 14 days in order to calculate this value. The same method applies for your self-programmed indicators. A 5 minute chart will call up the OnCalculate() for each 5 minute bar. If you want your self-created indicator to use a different timeframe, this is possible using multibars.
Example
using System;
using System.Collections.Generic;
using System.ComponentModel;
using System.Drawing;
using System.Linq;
using System.Xml;
using System.Xml.Serialization;
using AgenaTrader.API;
using AgenaTrader.Custom;
using AgenaTrader.Plugins;
using AgenaTrader.Helper;
namespace AgenaTrader.UserCode
{
    [Description("Multibar Demo")]
    // The indicator requires daily and weekly data
    [TimeFrameRequirements("1 Day", "1 Week")]
    public class MultiBarDemo : UserIndicator
    {
        private static readonly TimeFrame TF_Day = new TimeFrame(DatafeedHistoryPeriodicity.Day, 1);
        private static readonly TimeFrame TF_Week = new TimeFrame(DatafeedHistoryPeriodicity.Week, 1);

        protected override void OnBarsRequirements()
        {
            Add(TF_Day);
            Add(TF_Week);
        }

        protected override void OnInit()
        {
            CalculateOnClosedBar = true;
        }
        protected override void OnCalculate()
        {
            // The current value for the SMA 14 in the timeframe of the chart
            Print("TF0: " + SMA(Closes[0], 14)[0]);
            // The current value for the SMA 14 in a daily timeframe
            Print("TF1: " + SMA(Closes[1], 14)[0]);
            // Current value for the SMA 14 in a weekly timeframe
            Print("TF2: " + SMA(Closes[2], 14)[0]);
        }
    }
}
Additional Notes
When using additional timeframes, a further entry with the respective data series for the bars of the new timeframe will be added to the arrays Opens, Highs, Lows, Closes, Medians, Typicals, Weighteds, Times and Volumes. The indexing will occur in the order of the addition of the new timeframes. Closes[0][0] is equivalent to Close[0]. Closes[1][0] equals the current closing price for the daily data series Closes[2][0] equals the current closing price for the weekly data series
"Closes" is, of course, interchangeable with Opens, Highs, Lows etc.
See ProcessingBarIndexes, ProcessingBarSeriesIndex, TimeFrames, TimeFrameRequirements.
Additional syntax methods are available for multibars:
// Declare the variable TF_DAY and define it
private static readonly TimeFrame TF_Day = new TimeFrame(DatafeedHistoryPeriodicity.Day, 1);
private static readonly TimeFrame TF_Week = new TimeFrame(DatafeedHistoryPeriodicity.Week, 1);
// The following instruction is identical to double d = Closes[1][0];
double d = MultiBars.GetBarsItem(TF_Day).Close[0];
// The following instruction is identical to double w = Closes[2][0];
double w = MultiBars.GetBarsItem(TF_Week).Close[0];
ProcessingBarIndexes
Description
ProcessingBarIndexes is an array of int values that contains the number of ProcessingBarIndex for each bar.
This array is only of value for indicators or strategies that use data from multiple timeframes.
A new entry is added to the array whenever a new timeframe is added to an indicator or strategy.
With [TimeFrameRequirements(("1 Day"), ("1 Week"))] the array will contain 3 entries:
ProcessingBarIndexes[0] Current bar for the primary data series (chart timeframe) ProcessingBarIndexes[1] Current bar for the daily bars ProcessingBarIndexes[2] Current bar for the weekly bars
ProcessingBarIndexes[0] is equivalent to ProcessingBarIndex.
Also see MultiBars.
Parameter
barSeriesIndex Index value for the various timeframes
Usage
ProcessingBarIndexes[int barSeriesIndex]
Example
//Ensure that a minimum of 20 bars is loaded
for (int i=0; i<ProcessingBarIndexes.Count; i++)
if (ProcessingBarIndexes[i] < 20) return;
ProcessingBarSeriesIndex
Description
Within a multibars script, multiple bars objects are available. The OnCalculate() method will therefore also be called up for every bar within your script. In order to include/exclude events of specific data series, you can use the ProcessingBarSeriesIndex property.
ProcessingBarSeriesIndex is only of value for indicators or strategies that use data from multiple timeframes. With [TimeFrameRequirements("1 Day", "1 Week")] two timeframes will be added to the primary chart timeframe.
If OnCalculate() is called up by the primary data series, then ProcessingBarSeriesIndex will equal zero. If OnCalculate() is called up by the daily bars, then ProcessingBarSeriesIndex will equal 1. Weekly bars will have a value of 2.
See Multibars and ProcessingBarIndexes.
Parameter
none
Usage
ProcessingBarSeriesIndex
More Information
Within a script that only works with primary timeframes, the value will always equal zero.
Example
// To demonstrate the methodology
// set CalculateOnClosedBar=false
Print(Time[0] + " " + ProcessingBarSeriesIndex);
// Calculate only for the chart timeframe
protected override void OnCalculate()
{
if (ProcessingBarSeriesIndex > 0) return;
// Logic for the primary data series
}